
How to Make a Budget in Google Sheets (Step by Step)
Thirty minutes, three tabs, five formulas — and you never pay for a budgeting app again. Copy-paste every formula straight from this guide.
This walkthrough builds a personal monthly budget in Google Sheets from an empty file: a transactions log, your own categories, and a dashboard that totals each month automatically. The same steps work in Excel (here is how Excel and Google Sheets compare for budgeting), and the finished version is available as a free budget template if you'd rather skip the build.
Why Google Sheets beats budget apps
Budget apps charge $8–15 a month to show you your own spending. Google Sheets does the same math for $0, forever — and the file is yours: no server holding your transactions, no subscription creeping up, no app shutting down and taking your history with it. It syncs to your phone automatically, so you can log a purchase from the checkout line.
The trade-off is a 30-minute build (or 15 with a template — shortcut at the end). If you're still weighing spreadsheet vs app, the full comparison is in why a spreadsheet still beats budgeting apps — and once it's built, the best spreadsheet budgeting automation takes it the rest of the way.
The 3-tab setup
Create a new sheet (sheets.new in your browser — that's a real shortcut) and add three tabs at the bottom:
- Transactions — every expense, one row each. The only tab you'll touch daily.
- Categories — your 10–15 spending categories and each one's monthly budget.
- Dashboard — formulas only. It builds itself and you never edit it again.
One rule that saves the whole system: all transactions in one tab, forever. Monthly tabs feel organized but break every formula downstream.
Step 1: The Transactions tab
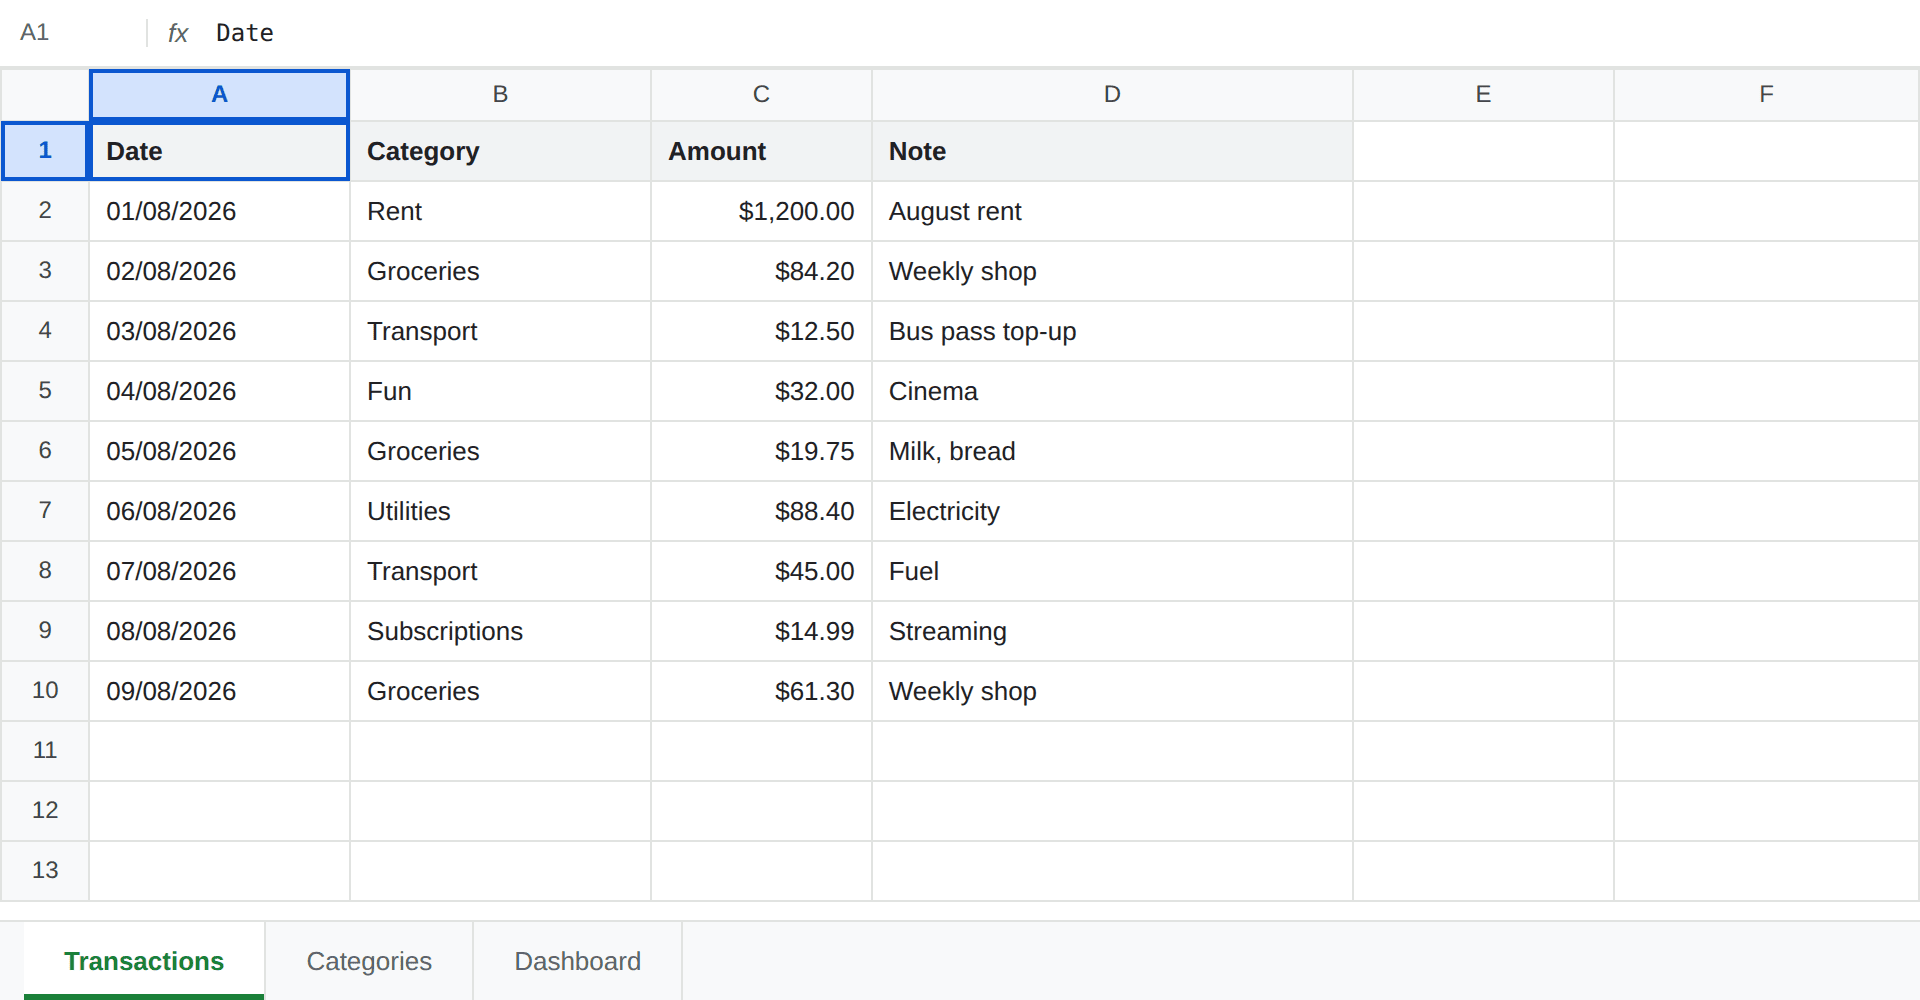
Four columns — A: Date, B: Category, C: Amount, D: Note. Format column A as a date (Format → Number → Date) and C as currency. That's the entire tab: each coffee, bill, or grocery run is one 10-second row.
Step 2: The Categories tab (+ dropdowns)
Column A: category names (Rent, Groceries, Transport, Fun…). Column B: each one's monthly budget — if you don't know the split, the 50/30/20 calculator gives you a starting allocation in one step.
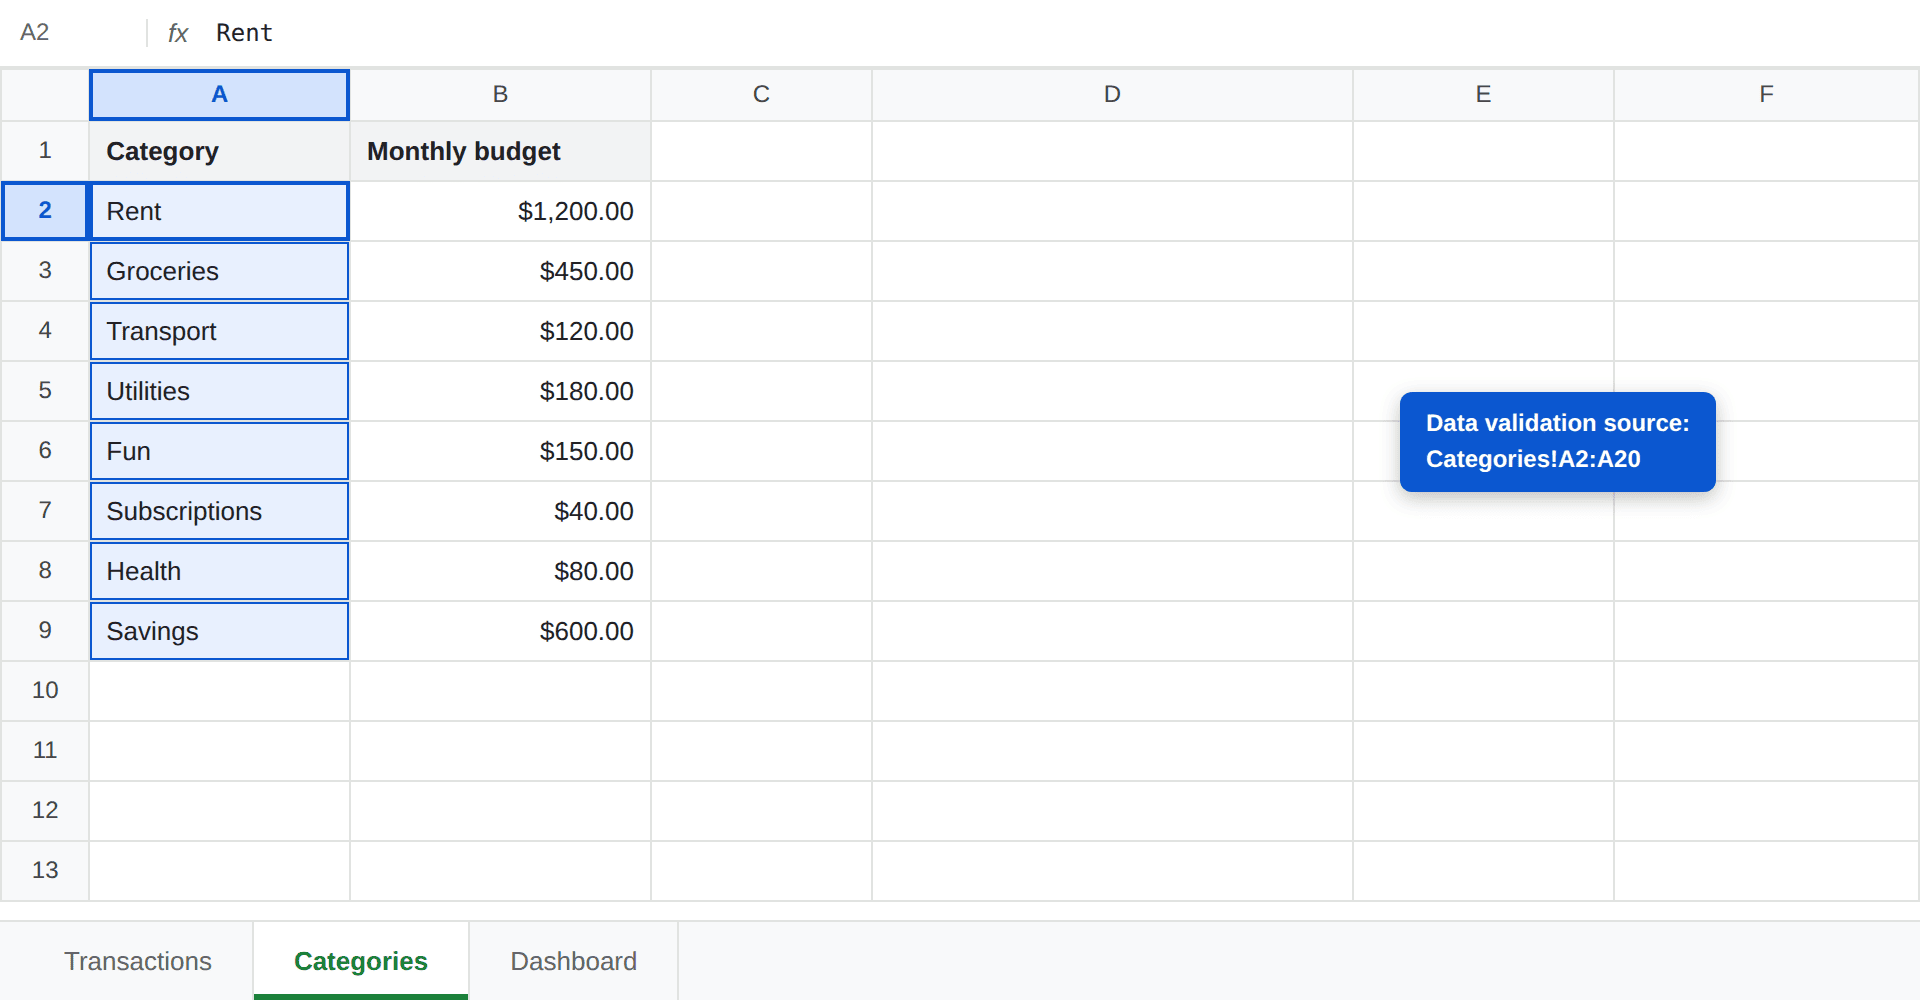
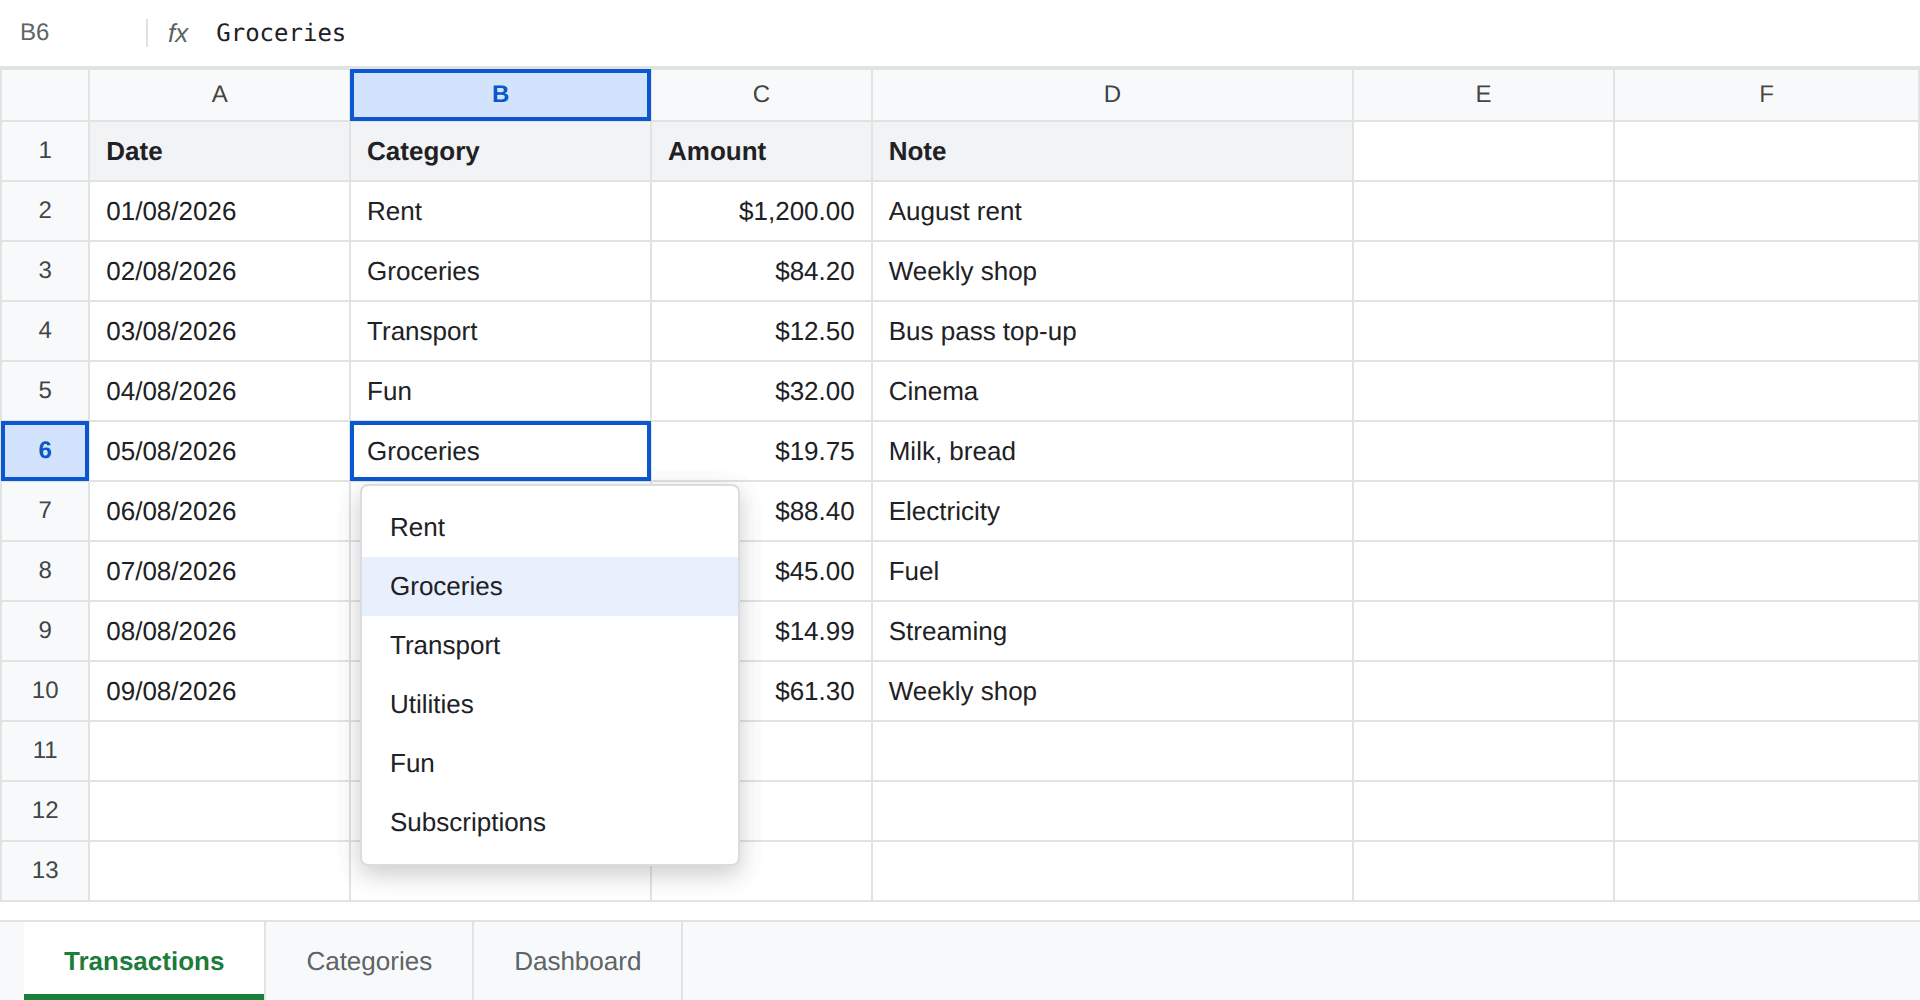
Now make the Transactions tab error-proof: select column B there → Data → Data validation → Dropdown (from a range) → point it at Categories!A2:A20. Every entry now picks from a dropdown — no more "Groceries" vs "groceries" splitting your totals.
Step 3: The Dashboard (the 5 formulas)
On the Dashboard tab, build one row per category. Say row 2 is Groceries:
- Category name (A2):
=Categories!A2 - Budget (B2):
=Categories!B2 - Spent this month (C2):
=SUMIFS(Transactions!C:C, Transactions!B:B, A2, Transactions!A:A, ">="&EOMONTH(TODAY(),-1)+1) - Remaining (D2):
=B2-C2 - Total row at the bottom:
=SUM(C2:C16)against=SUM(B2:B16)
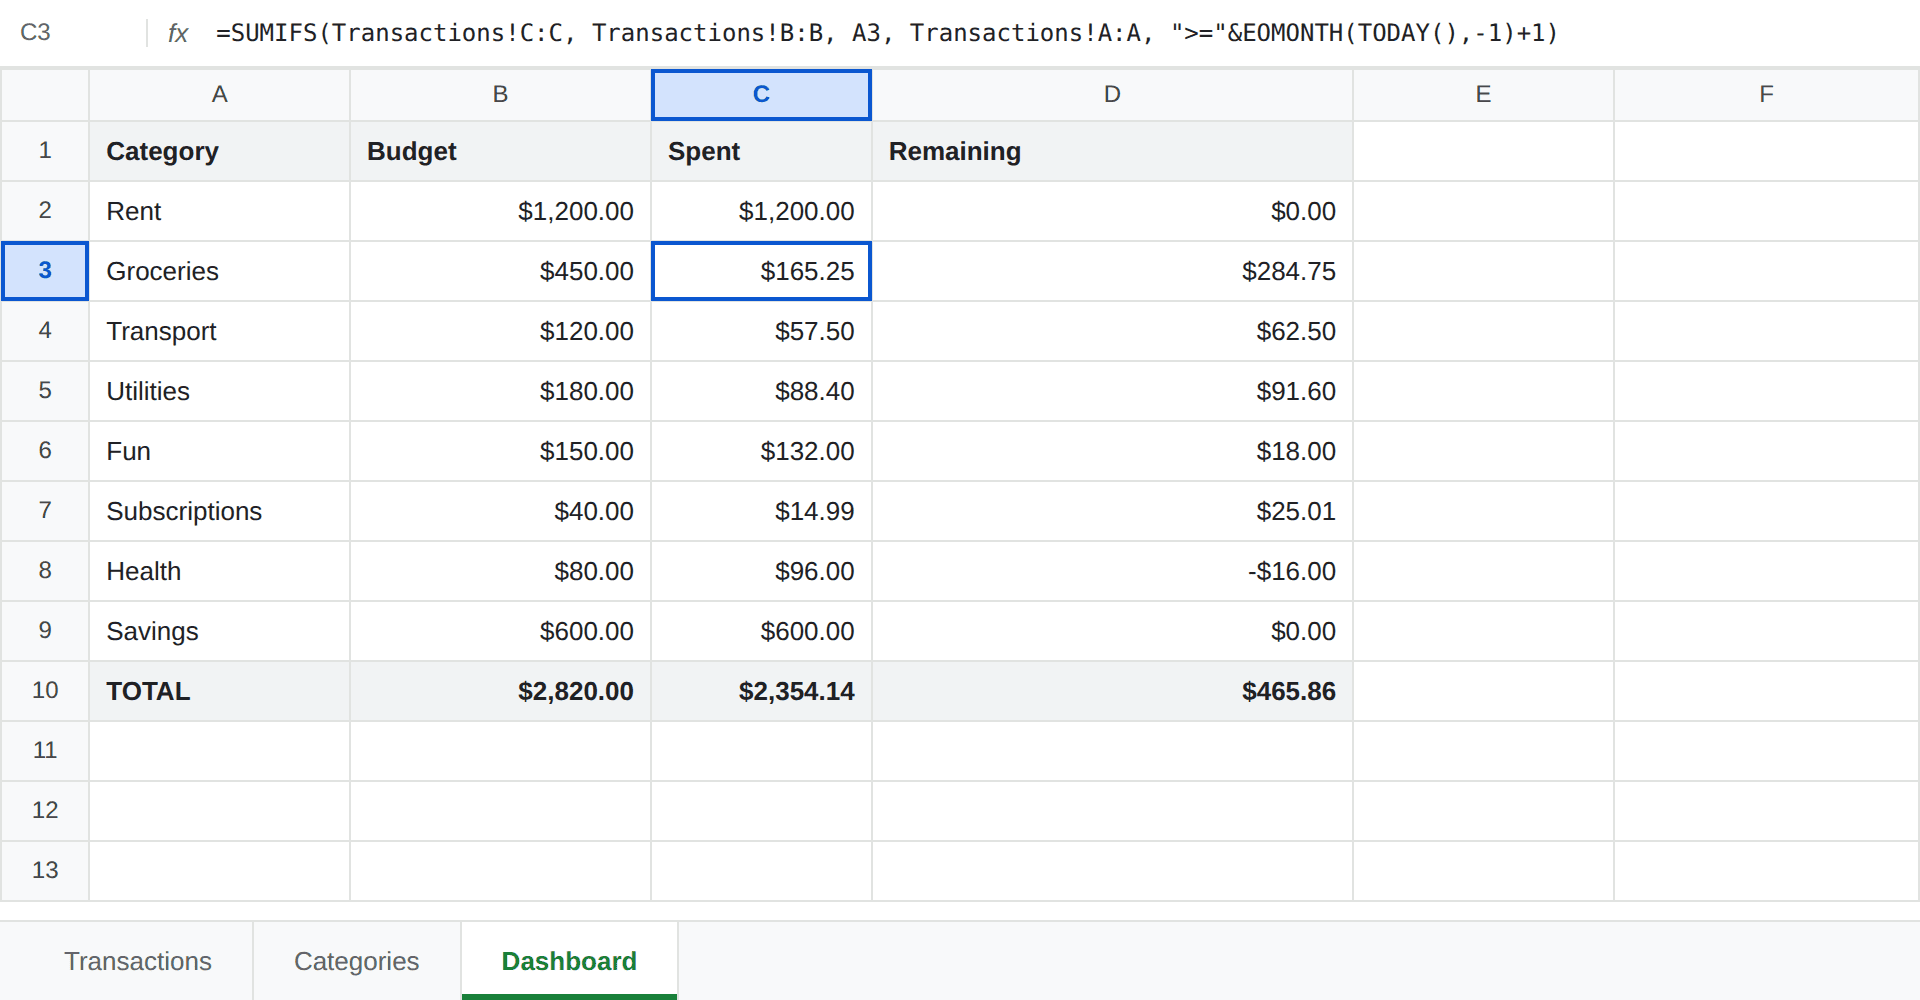
Drag row 2 down for every category and the dashboard is alive: every logged transaction updates its category, the month resets itself automatically (that's the EOMONTH part), and you never rebuild anything. This is the same engine behind a fully automated budget spreadsheet — SUMIFS does the heavy lifting. If it ever returns 0 or a total that looks too low, see why SUMIFS stops adding up.
Step 4: Overspend alerts
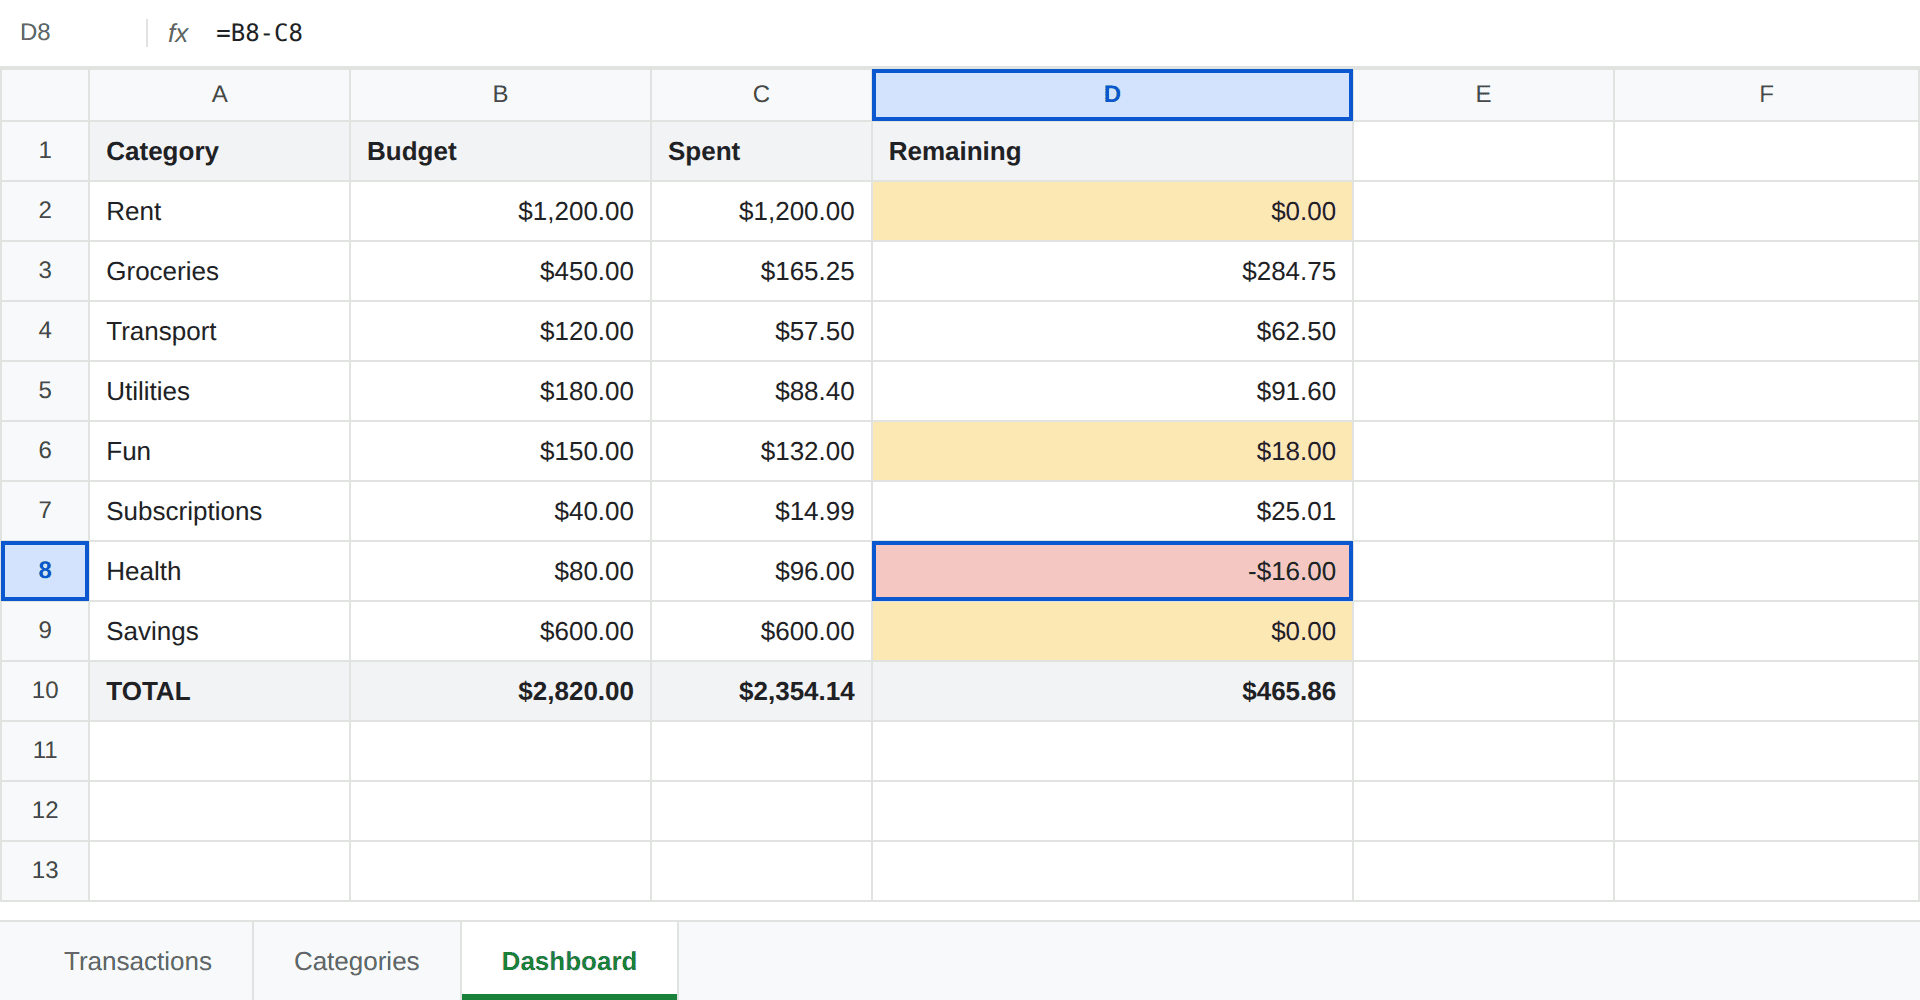
Select the Remaining column → Format → Conditional formatting → "Less than 0" → red fill. Add a second rule: "Less than" =B2*0.2 → amber. Now the sheet flags trouble at a glance — you check colors, not numbers.
The 5-minute weekly routine
- Log as you go (10 seconds per purchase from your phone), or batch it: download your bank's CSV once a week and paste into Transactions — five minutes total.
- Scan the colors. Red category? That's this week's decision, made for you.
- End of month, do nothing. The EOMONTH formula rolls everything over automatically.
Don't want to build it yourself? Grab the finished free budget template — the same three tabs and formulas, already wired up, free and no signup. Make a copy in Google Sheets and it lands in your Drive in one click. Or, for the full system with debt payoff, savings goals, net worth and subscriptions built in:
Frequently asked questions
How do I make a monthly budget in Google Sheets?
Create three tabs — Transactions, Categories and Dashboard. Log each expense on the Transactions tab, set your monthly budget per category on the Categories tab, and let a SUMIFS formula on the Dashboard total each category for the current month. The month rolls over automatically, so you build it once rather than rebuilding every month.
Is Google Sheets good for budgeting?
Yes — for most people it's the best free option. It's $0 forever, works on any device, syncs automatically, your data stays in your own account, and with a few formulas it automates category totals and overspend alerts like a paid app.
How long does it take to build?
About 30 minutes for the three-tab setup in this guide. After that, upkeep is roughly 10 seconds per logged purchase or a 5-minute weekly session if you batch it.
Google Sheets or Excel for a budget?
The formulas are identical. Google Sheets wins for most people because it's free, cloud-synced, and easy to update from your phone; Excel is stronger for very large files and power users.
Can Google Sheets pull my bank transactions automatically?
Not natively. The standard workflow is downloading your bank's CSV and pasting it into your transactions tab once a week — about five minutes. Third-party add-ons can sync banks, but they reintroduce the subscription and privacy trade-offs of an app.